Last year I ran the sims and determined that we were drafting the Zamboni all wrong. A year has passed, and, well, that means another chance to break out my incredible coding abilities and take a look at the Zamboni. Turns out, we’re drafting better, but it’s still not close to optimal, per the sims.
I conversed with ChatGPT for a few nights trying to get something that functioned with more than 100 sims. I did not succeed. Alas, we have another year of playoffs, and another year of drafted playoffs rosters, to run through the sims and analyze.
I feel that, more than ever before, in fact, that The Zamboni is about as far away from Best Puck Classic as it gets. I wrote about those reasons last season, and the findings I have only further support the differences. From last year:
What it didn’t do, however, was make me feel confident that we can translate strategy from [BPC] to the Zamboni contest. The NHL Playoffs are a completely different game, something that drafters know from playing NFL Best Ball in both the regular season and playoffs. Not only does the intensity get ramped up to 105% on the ice, but the simple game mechanics do a complete 180:
All 32 NHL teams will be in action during the BPC finals. Only two will be playing for the Stanley Cup in the Zamboni finals, where the huge prizes wait.
Only sixteen teams qualify for the playoffs, and of those sixteen, at most 12-14 are teams that we can feel confident will qualify, let alone compete for the Cup, for the first round of play at this point. Perhaps drafting in the final week before the contest closes will alleviate some of that pressure, but it’s also very hard to draft in bulk for the MMEers at that point.
Drafts are made up of six drafters, as opposed to twelve like in BPC. This means that the elite combos will be easier to grab, and better players will be available later.
BPC rounds consist of weeks, which tend to have very close to 3-4 games, with the rare exception having some teams hit 5 or 2 games. The Zamboni unit of time is a round, which can range anywhere from 4-7 games. Having the best team in a sweep can be counter-productive, actually, when others get 7-game series.
One final relevant point is the scoring structure: each drafted team starts their best player at each position, plus TWO skater flex spots. This is in direct opposition to BPC, where there is one flex but two W spots, and effectively makes roster construction much looser in the Zamboni.
Oh, hey, Underdog updated that last one! My Best Puck Manifesto 2025 update dives in to discuss how that changes regular season strategy, if you missed it.
Since I didn’t reinvent the wheel this year, here’s how I positioned the sims-creation process last year. I have updated the text accordingly where necessary (and added notes where the graphics are not updated) that include the preset team strengths, which of course are relevant to determining how the set of NHL Playoffs are simulated:
So how do we combat all of these differences? Well, the first thing I thought was to whip out the same code as the BPC, make a couple changes, and just run this data through it to report back what works when drafting.
Then I realized that was stupid, and I should do something 350x more complicated. Kind of.
In short, there is no way to “hack” the playoff data we have available, like I did with the BPC data, to give us the sample sizes required to draw any useful conclusions. Each playoff series is so overwhelmingly important because only one team moves on, and the length of the series controls how much opportunity drafters get to secure fantasy points from their drafted players, not to mention of course how high-scoring those games are (and even whether one game goes to three overtimes…). Substituting in rd4 outcomes as rd1 outcomes makes no sense, because fourteen teams will get straight 0s across the board while Edmonton and Florida will advance at 100% rates. (ED Note: I didn’t have to update this part. Thanks, NHL!)
Thus, the need for a sim was born. As a certified idiot whose experience with hackneyed R coding boils down to barking commands at an AI agent until I get something that works… this was an endeavor. Here’s how I did it, feel free to skip if you don’t care about the particulars to the bold, underlined section header.
I simulated the outcome of each playoff bracket as it stood on opening night of the 2024-25 playoffs. This means that the matchups and divisions were 100% known in my universe. This, of course, is not the environment we draft in during early March (or even April), when seeding remains up in the air.
I fed all available odds from the 2024-25 playoffs to the robots and received a set of “strength vs. average team” figures back. I massaged them slightly, then established a team ELO using the formula: initial_elo = 1500 + 200 * (avg_implied_prob - 0.5). See below if you’re particularly interested in the end result.
Team | 2025 Strength |
|---|---|
FLA | 0.57 |
TB | 0.56 |
CAR | 0.54 |
EDM | 0.53 |
COL | 0.53 |
LA | 0.52 |
VGK | 0.52 |
DAL | 0.52 |
TOR | 0.52 |
WPG | 0.51 |
WSH | 0.50 |
NJ | 0.41 |
MIN | 0.40 |
STL | 0.40 |
OTT | 0.39 |
MTL | 0.36 |
These ELO ratings set a range of team strengths that were applied directly to the first round matchup, with a game-by-game build/decay factor implemented to starting ELO based on the game results, as well as a home-ice advantage coefficient (home-ice is known through rd2, I left it up to ELO after rd2, I suspect this is frivilous but also I think helps to avoid overbiasing the results in favor of one NHL team in case my home-ice advantage was too strong). Thus, teams that win more build their ELO rating more quickly, and can level up over the course of the playoffs. This ensures that Cinderella runs are at least possible given the known chaos of the NHL playoffs unlike a league like the NBA (which if anyone has good The Dance writeups from that playoff contest on Underdog, I’d be very interested in reading/comparing!) and that better teams are more likely to play fewer games (because they are winning series quickly).
After simulating the entire playoff bracket via the above process, then I worked out an incredibly basic system to apply player-level fantasy points per game. I gave it my best effort to set realistic baselines for all players in this contest based on their actual results as well as their expected results, which I loosely based on ADP. This data was sourced from play-by-play logs from evolving-hockey.com, because date-kept data that is far easier to source doesn’t help when the NHL has a Game 7 on the same day it starts a different series in the other conference with Game 1. The NHL rocks.
Most critically, I needed a strategy to assign udpts in a way that resembled real life, where winning teams would likely have better fantasy performances, but not always. This was the only way to ensure that I was not losing valuable signal in the sim process. I even found during this approach that when you group players by position, their win vs. loss game logs take on completely different shapes. Like, what the fuck man, why are you going to do this to me?
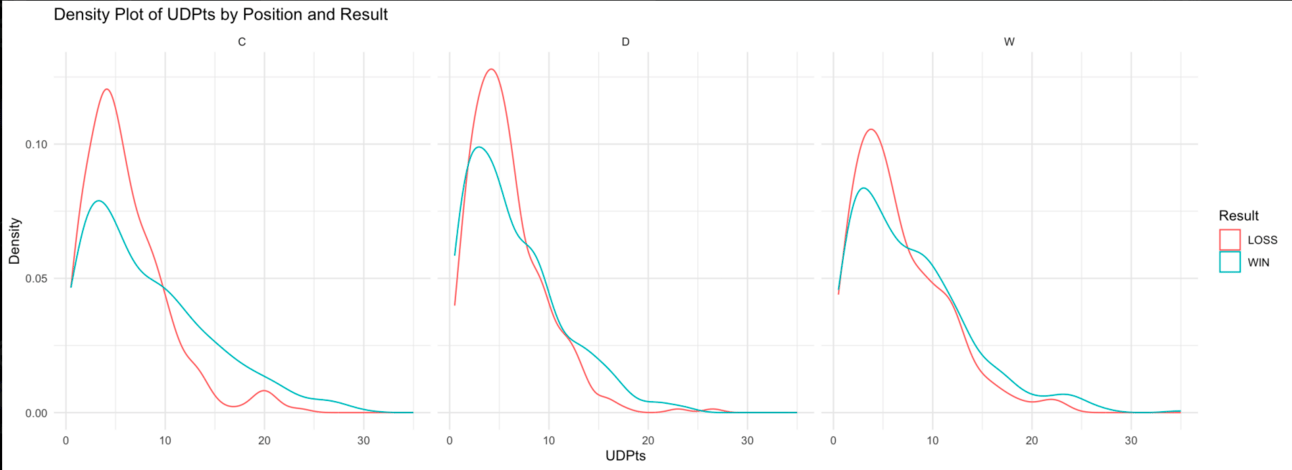
Centers, in losses, have a far greater spread between fantasy performances vs. wins than is the case for other positions. {2024 Data}
Thus, the player sim pulls from a specially constructed distribution for each player that is also informed by the position they play; the “volume” positions in W and D have less deviation than at C between wins and losses, where the data shows a large gulf between the scoring in wins vs. scoring in losses. I thought this table was cool, too, further proving the need for this elaborate step:
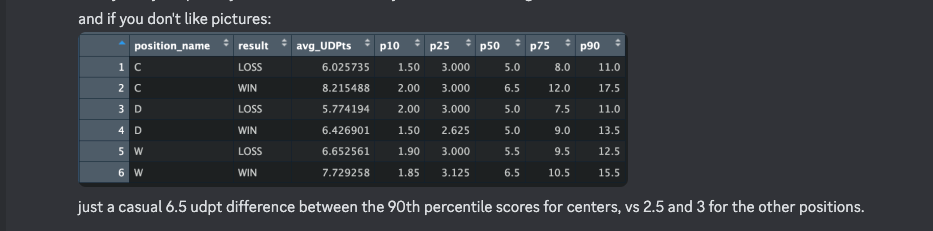
2024 Data
I worried this was a McDavid effect (given the outsized importance of his fantasy production on last year’s playoffs…), and after sorting each position into tiers based on fantasy production found that the middle and lower tier of C showed a similar pattern, so I moved on. A very cool finding that one day I’m sure will have NHL front offices falling over themselves to hire me.
Armed with playoff sims, I then used these player baselines and distributions to sample fantasy point production, which then allows me to model the UD contest itself. I treated all ~10k contest entries as the field for all simulations, thus all findings you’ll see are actual teams that real people drafted. Off-the-wall strategies that have never been tried need-not apply, though if you have one, put it in place for 25-26 playoffs and maybe you’ll find me writing the 2027 manifesto update about your genius build!
Final note, remember that in rd1, 2/6 from each pod advanced last year, PLUS the 308 best teams that did not finish 1st or 2nd in their pod because of contest overlay. These teams were then randomly assigned new rd2 pods of 8, with the top 1 advancing, then assigned new rd3 pods of 5, with the top 1 advancing. The 93-team final then determines the remainder of the prize pool, the totality of which can be found here. $100K in total was paid out for every sim, a fact which I checked and am very proud of (tiebreakers were an absolute bear for my pea brain to explain to the computer) (OK, 2026 was not as kind, I got to 99.6k paid out and gave up. I’m sure it’s fine). Note that EV calculations that follow are not based to $0, considering that the contest has rake taken out but costs $10 to play. The rake was reduced thanks to the contest not filling, but the field still paid $102,360 to play and received back $100,000.
I wanted to run 1000 sims, then 500, but for computer memory reasons was forced to limit it to 100 sims. Bah humbug. (I think I got 250 to work, but it crashed my computer at the end during an overnight run. So back to 100 we go.)


What follows are the results I found after simming the 2024-25 NHL Playoffs 100 times and tallying the results based on real teams drafted in the 2024-25 Underdog Zamboni NHL Contest:
I wasn’t supremely confident that one hundred sims of one contest was enough to confirm these takeaways last year. Fortunately, they all seem to have been spot on, when adding this year’s worth of data. Let’s cover those quickly, before getting into two NEW topics:
You aren’t stacking enough. Basically, 4-stacks are bad, 6 stacks are good.

2024 Red = Incidence (Drafts), Blue = Wins

2025 Red = Incidence (Drafts), Blue = Wins
In 2024, six-stacks win 53% of the time, and 7s win 22% of the time in my sims, making a 6+ stack a winner 75% of the time! This is slightly flawed, as this methodology counts a win as a win regardless of whether it was a chop for first place or not, but it is worth considering that 6+7s are drafted at a ~29% rate. That means that 75% of winning lineups came from just 29% of drafts!
In 2025, the field took far more 6+ stacks, totaling ~47% of all drafted lineups that contained at least 6 players from one (playoff) team. This is still far below the GTO rate, as these teams won 79% of my sims (vs. 75% last year)! Continue loading up on 6+ stacked builds and you’ll continue to produce positive EV drafts.
Expected Value (EV), which is an all-encompassing figure taking into account winnings (and subtracting entry fees), tells a similar story:

2024

2025
Based on 2024: When you max out at stacks of 4, EV is negative. It trends up for 5s, and peaks at 6, before falling back down a good amount for the 7-5 drafts.
I suspect that better drafters continued to press their stacking edge in 2025, as the dynamic shifted slightly so that stacks of 7 from one team also perform quite well, about on par with 6-stacks. Because more 6+ stacks were being drafted, the EV of those was reduced by ~half, which is just about entirely explained by the presence of ~2x more of these 6+ stacks to divvy up EV across.
Let’s modify point #2 from last year, because while I provided more detail last year, I don’t think it is necessary anymore to prove the point, and it directly builds off of this 6-7 stack talk {insert hilarious hand motion here} we are having.
In 2024,
Stacking at least one team with six players is clearly superior, with even larger stacks also showing out surprisingly well
In 2025,
You should be drafting highly drafted teams in a more concentrated way; teams that aren’t frequently drafted (due to low Cup odds) tend to benefit from more humility in your selections.
Here’s the chart. I’ll explain after. The stacks are the same exact cuts as above, except now they show EV in two different subsets of the sims:

Set 1 = CHALK sims, in black, indicate sims where the Cup-winning team was a CHALK team - the 5th player drafted had an ADP < 50 for this team, indicating the field was confident (and thus these teams tended to have a 6-stack in every draft, unless multiple people started fighting for the same team and they gave up). Last year, there were six of these teams: COL/DAL/WPG/EDM in the West, and TB/FLA in the East. 58% of sims contained these teams as Cup Winners.
Set 2 = CONTRARIAN sims, in red, indicate sims where the winner was, in theory, able to be “six-drafted” in the late rounds. The 5th player drafted had an ADP > 50. This, of course, includes some teams with players going semi-early as well as teams with players who entirely go late, but there were only 42% of sims where the winner was any of the following: STL/VGK/LA/MIN in the West, TOR/OTT/CAR/NJ/MTL/WSH in the East. FLA and TOR, for example, barely miss the cut, while MTL and OTT were hardly ever drafted. I don’t think I have the relevant sample sizes to split these groups apart.
The first thing I recognize is the strength of 5-5-2 stacks among “Contrarian” winners, as opposed to their relative weakness when “Chalk” wins. This tells me that in the case where a relatively unexpected team makes it to the Cup Final, we don’t need to have a full team to be competitive. There simply aren’t enough drafted rosters of these teams to survive the three round gauntlet, and so having the extra flexibility (what I deem as “humility” in not turning your 5-5 into a 6-6 to give yourself additional outs in advancement) benefits these teams greatly.
However, when you have a chalky team winning it all, there will be lots of 6+ stacks of that team and they will flood the final round of the contest, making it nearly impossible to not be blocked by a number of lineups (they get all the points you do with your 5, PLUS some from the 6th player). This is how you go from the 5-5-2 strategy being literally the best possible strategy when a contrarian team wins to a negative-expectation strategy when a chalky team wins.
You can of course quibble with the process of what contrarian means (as last year’s WC bubble teams and VGK are not the same, IMO), and I suspect that with more sims (and more drafted lineups) we’d see 5-5-2 not be the strongest when a contrarian team wins, but I certainly believe that this is directionally accurate and one of the most pressing things to consider when you are drafting teams (and effectively betting on who will win the Stanley Cup) in the Zamboni.
One other thing that I note in the Chalk/Contrarian splits above is that it shows the vast majority of the EV gained from 7-stacking comes from these chalky teams. You’re overdoing it, to some extent, when 7-stacking a team that is not very likely to make the playoffs. Because we are competing for $10000, and not $1000000 like some certain contests (or even $2 Mil), going this far off the reservation has drawbacks, and the EV calcs support it. Basically, if you can easily get a 6-stack in the draft lobby, stop there. If you can’t, it may be worthwhile to mix in a 7th player on occasion who can offer an extra leverage point in the finals since you’ll be going up against a lot of 6-stacks, some of whom are similar/identical to yours!
Draft one or two goalies, it doesn’t matter — but absolutely do not draft three or more goalies.

2024 Reminder that there is rake involved, so 1 vs. 2 goalies is effectively a rake-neutral decision, anything more is catastrophically bad.

2025, no drafters took 4+ Gs, sadly.
From 2024: This one also surprises me, a little bit. The vast majority of teams take 2 Gs, which makes perfect sense to me. I was a bit surprised to see that 1s were actually (slightly) higher EV. It’s clear in the data that losing the skater roster spot that a third goalie represents is very detrimental to your Zamboni outlook.
G | n | rd2_adv_rate | rd2_to_rd3_ratio | rd3_to_rd4_ratio | EV | win_rate | draft_rate | G_category |
|---|---|---|---|---|---|---|---|---|
1 | 1856 | 0.346 | 0.132 | 0.213 | 0.10 | 24.0% | 17.7% | 1 |
2 | 7599 | 0.358 | 0.126 | 0.201 | -0.22 | 73.3% | 72.5% | 2 |
Early advancement advantages (35.8% vs. 34.6%) for 2-goalie teams get wiped out in later stages (presumably where the extra skater matters more with eliminated pieces of rosters), culminating in a win rate of 24% for 1G teams despite them making up only 17.7% of all drafted rosters. This results in a net EV difference of 33 cents, so I wouldn’t confidently state 1 is better than 2, just that both are clearly superior to 3G builds!
In 2025, this same data persists, though it shows 2 is a bit better than 1. 3 is just a non-starter. Draft 2 goalies. If you really feel good about your 1 goalie in a 6 or 7 stack.. go wild on skaters. I don’t personally feel the risk is worth torching an otherwise great team due to one injury or coaching decision, setting aside team success contingency, but the EV is about similar.
I am once again taking the liberty (gibberty? bibberty. we’re almost in NHL Playoff Commercials season!) to move past this tenet from last year. The trend persists, but I am going to move into a different topic entirely.
Positional Allocation shouldn’t really matter - but Ws still do?

2024

2025
My theory on why EV is highest for 5 & 6 W teams, and pretty poor for 3 & 4s, is that it is very difficult to stack 6 players from a team without getting a bunch of Ws, especially since few teams have more than 2 viable C options. With double the Ws per team, we could just see a factor of the earlier Stacking notes playing a role here in the data.
Note that in 2026, Colorado could be an exception to this rule, especially if you have MacKinnon. You may be able to get away with 4 or even 5 Cs on a team because of how highly the flex scores COL will create are relative to the W scores available (especially if Necas is limited in any fashion).
The data does seem quite clear though that we should only be drafting two defenders per Zamboni team. The lowest-scoring position in fantasy doesn’t require much investment to produce usable scores, as-tested by nearly 4,000 drafters in 2024 and 2600 in 2025 whose results when drafting 3D fare more than a dollar worse in the aggregate across all 100 sims.
4 but for real now:
ADP literally couldn’t matter less.
That’s right. It is provably bad to follow ADP, even super early in drafts. See for yourself:

The goal is to “maximize EV” which in this color scheme is to advance from purple to yellow
Think of this as a visual representation of the draft board. At any spot on the X-axis, you can diagnose where you sit RIGHT NOW when you’re on the clock. When you make your pick, you can either A) reach for a player past ADP or B) take a player who is at ADP or an ADP value.
We learned in BPC that it is incredibly strong to simply follow ADP for the majority of your picks, otherwise you’re ceding value to the field. In the Zamboni, however, following ADP is what gets your team killed. In almost any spot on this board, it is optimal to continue reaching to complete your team. When considering the many inputs, the TEAM and POSITION and how that fits in with your team would appear to be massively more important than the ADP, or the value the field attaches to said player.
In round 1, it is impossible to have reached already, so you can either take a player at ADP or reach. If you take someone at ADP, you remain on the 0-line of the Y-axis. If you reach, you climb up, diagonally and to the right. Even here, in round 1, the data shows it is “better” to have reached. In this particular case, there is only n=79 of 10k+ drafts, but this trend persists literally all over the board. Go stand in any one spot and compare the square directly to your right and the square diagonally up and to the right, and that diagonal square is almost always brighter. This indicates that across all these drafts and all these sims, reaching was statistically the right play.
Now, you shouldn’t be reaching “for the sake of reaching”. But when it comes to drafting on the clock and determining how you build your portfolio, it practically doesn’t matter if you leave sterling values to your competition. What matters more, so so so much more, are the elements of correlation within your lineup. Sure, you can intelligently buck this trend and take an ADP value and still focus on stacking and positive-EV principles. But what I want to instill is a fearlessness and reckless abandon that comes when you free yourself from ADP. (Also, don’t snipe me bro. It’s not worth it)
If you’re not following the chart, that’s ok. I look at this and see what I want to out of it, but I know it’s not visually appealing… at all. But give this a try and think about how you progress through a draft with this table in mind.

a vast majority of the EV you gain is by simply not being an auto-drafter, it appears.
Note that I made it impossible to “reach” past round 9, as the field does a pretty good job of scrolling at this point, anyway, hence the stability in R10-R11-R12.
Here are the top drafters in 2025. countmc, the winner in 2024 who also topped the sim results in 2024, appears once again… while moods does not. My own sims (and my perverse belief in the Toronto Maple Leafs…) have conspired against me.
Congratulations to mnewtsy, who laps the field in my sims, holding off a tough field of users with 50+ drafts.

This full dataset (n>20 drafts) is posted in MSP Discord, where we can point and laugh at the big losers like me.
I have a bonus item, because I mentioned it on my stream with Jon from the Badge Bros and honestly didn’t recall not including it last year until I read that I had alluded to it, but wasn’t comfortable stating it as proven fact.
Do not, under any circumstances, draft players that play for teams within the same divisional bracket.

I am comfortable saying this now with another year of data. Don’t stack within a division. This, of course, is tougher to avoid in the weeks before the playoffs begin, but by simply avoiding the guaranteed elimination (because each division contains a pod of 4 that will never change, no matter the playoff results, spitting out exactly one team into the final four (Conference Finals) round), you gain tons of EV, even when controlling for stack type (since unstacked teams are more likely to have this take place, and we know those teams suck).
This trend is massive. This effect is not as strong within conferences, but it should go without saying that you’d love to have a chance to advance two different stacks to the Cup Finals (and unless another pandemic strikes, the East will always play the West!). You’re probably submitting to fancy play syndrome if you’re trying to stack a team of 6 with a 5 stack from the same conference and a one-off from the other conference.
That’ll do it for this year’s Zamboni sims. If you ever come across playoff best ball contest content for other sports, please think to send it my way. I don’t play other sports in the Best Ball world, but I find the theory fascinating nonetheless and I think it could be useful to directly energy in the NHL space.
In continuing the spirit of giving, here’s a link to an effort that DJ is supporting on behalf of one of his beer league buddies (and their family). I loved this bit of background:

If you have any specific questions, feel free to float them my way on Twitter, @FakeMoods, in the Morning Skate Podcast Discord (#dog-app channel), or in the Deposit Kingdom Discord (#badge-bros #puck thread). I can’t promise I’ll be able to answer them, because I’m a relative novice at this, but I’d love to hear your feedback and what you’d like to see.
Happy Drafting, and thanks for reading!
Follow me on X @FakeMoods, and to subscribe to this newsletter. I write ~once a week during the NHL DFS season, previewing DFS slates or reviewing the major contests on DraftKings. You should also subscribe to DJ Mitchell’s YouTube channel, where we stream MSP live (or post right after recording) on Monday and Wednesday nights. We plan to be live on Saturday as well to go over the massive day of games around the league. I am posting some stuff on my own personal YT channel as well, with a few pre-season Underdog drafts up at the moment and our preseason betting deep dive. And join the Discord (DM me if you want in the MSP Discord), if you somehow haven’t already. The Morning Skate Podcast is on iTunes, Sticher, Spotify, and (probably) any other podcast app of your choosing!